Data visualization and reporting tools are becoming increasingly essential for teams to make sense of large amounts of data. Such tools allow companies to analyze data and gain insights for better decision-making.
In this article, we'll explore some of the most popular data visualization and reporting tools available in the market, their features, and how they can benefit teams of all sizes.
1. Tableau

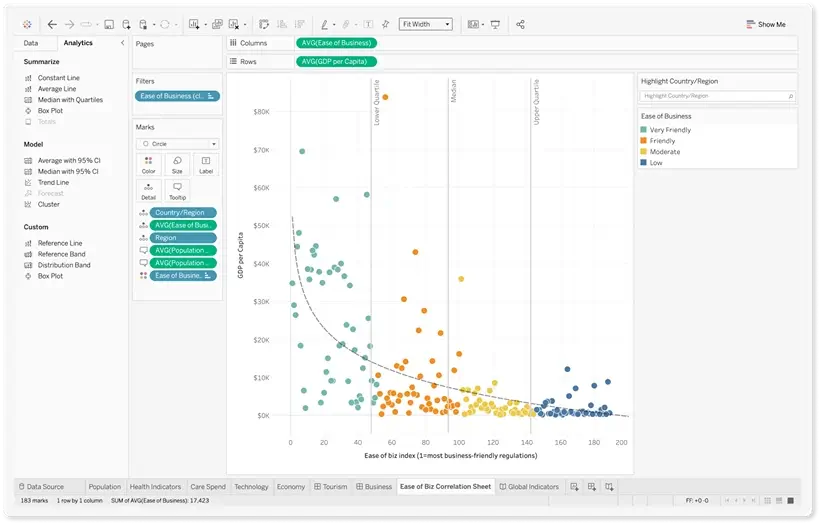
Source: Tableau.com
Tableau is a popular data visualization platform that helps users analyze, visualize, and share data. The platform allows data analysts and other professionals to create interactive and intuitive data visualizations and dashboards.
Tableau is well-known for its ability to process data and provide the desired output quickly. It has an intuitive drag-and-drop interface where you can create complex data visualizations without any coding knowledge.
One of the standout features of Tableau is its ability to prepare, clean, and format data before creating data visualizations. It ensures that the data is accurate and meaningful to use to draw insights and conclusions.
Tableau offers a range of visualization options, including charts, graphs, maps, and more. Users can customize these options and share them with team members or stakeholders to suit their needs.
Tableau offers a 14-day free trial, after which users can choose from various pricing plans, such as Tableau Creator, Tableau Explorer, or Tableau Viewer.
2. MeisterTask

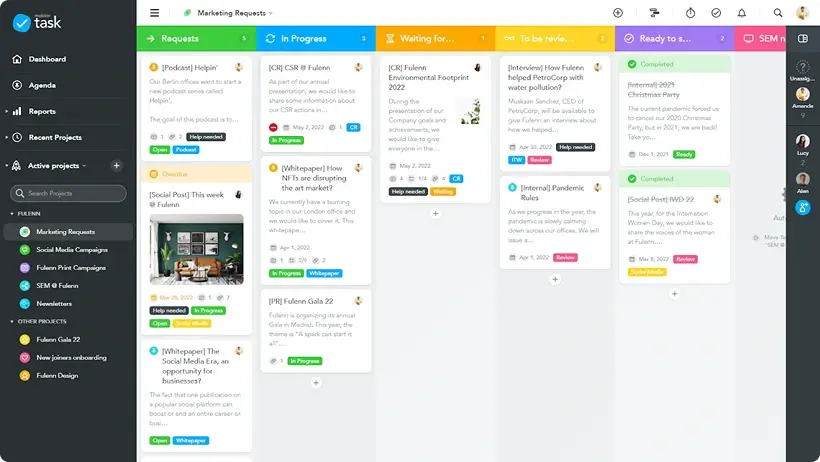
Source: softwareadvice.com
MeisterTask is a convenient project management tool designed for agile teams. You can use it to track team productivity, make progress, and time or safety reports.
MeisterTask has an easy-to-use interface that is intuitive and pretty user-friendly. It also offers some dashboards to construct customized agendas for teams.
One of the main features of MeisterTask is that it gives detailed information on completed, overdue, or impending tasks. Project managers can use this information to identify areas for some improvements.
MeisterTask also offers real-time collaboration, enabling team members to collaborate on projects and tasks. It also integrates with other tools, including Slack, Google Drive, and Dropbox.
The app offers a free premium plan with extra features like custom backgrounds, task automation, and more.
3. Looker
Source: Looker.com
Looker is another fantastic data visualization tool that can analyze data to extract helpful insights. It delivers real-time data dashboards for in-depth research, allowing businesses to make quick decisions based on the data visualizations.
The best benefit of this app is that Looker connects to various data sources, including Redshift, Snowflake, BigQuery, and more than 50 SQL dialects. It enables users to connect to many databases without any difficulty.
Another standout feature of Looker is its ability to create custom metrics and dimensions. This feature allows users to analyze data to suit their specific needs best. Looker also offers data exploration features for uncovering insights and trends.
You can find various visualization options, including charts, graphs, and tables. These visualizations can be easily customized and shared with team members or stakeholders.
Looker offers a pricing quote based on the specific needs of the user. Interested users can request a quote by filling out a form on the Looker website.
4. Google Data Studio

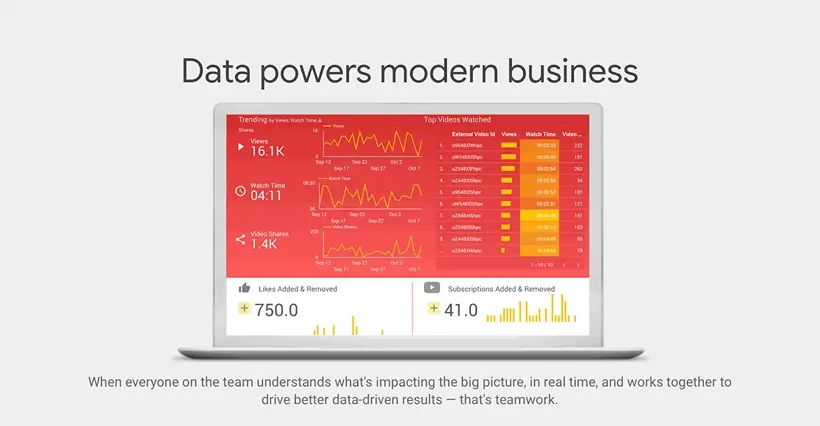
Source: atastudio.withgoogle.com
Google Data Studio is a free application that allows users to create detailed reports and dashboards from various data sources, including spreadsheets, Google Analytics, and Google Ads.
One of the most remarkable features of Google Data Studio is its simplicity. Even beginners can easily navigate its user-friendly interface and create compelling data visualizations without needing any coding or scripting knowledge.
Google Data Studio offers a range of pre-built data connectors, data visualization options, and generated metrics. These features make creating custom dashboards tailored to the user's specific needs easy.
Google Data Studio also allows users to set custom filters to ensure that data is presented how they want it to be. It enables users to create custom reports focusing on specific metrics or dimensions.
Another key benefit of Google Data Studio is its collaboration features. The dashboards created using the tool are shareable, meaning that team members can access the data crucial to making decisions.
As for the pricing, Google Data Studio is a free tool that makes it accessible to teams of all sizes. Users who need additional features can upgrade to the paid version.
5. Microsoft Power BI
Our fourth choice is Microsoft Power BI, a business analytics service that provides interactive data visualizations and business intelligence capabilities.
Power BI allows users to connect to various data sources, including Excel spreadsheets, cloud-based and on-premises data sources, and streaming data. Users can also clean and transform data, create data models, and build reports and dashboards.
The main advantage of Power BI is its ability to create custom visuals. Users can choose from a range of visuals available in the marketplace or create their own using the open-source custom visuals framework.
Power BI also integrates with other Microsoft products, including Azure and Office 365.
The free version is available for users, but you can also find a range of paid plans that offer additional features, such as increased data storage capacity, data refreshes, and more.
Conclusion
Data visualization and reporting tools are essential for teams to gain insights from large amounts of data. These tools can help teams make informed decisions and improve productivity by providing actionable insights.
Tableau, MeisterTask, Looker, Google Data Studio, and Microsoft Power BI are just some of the popular data visualizations and reporting tools available in the market.
